
 Subscribe
Implementation Capacity and Evidence-Based Practice Fidelity
It’s fall in Minnesota, a time of year when apples (including MN-invented ones, looking at you, Honeycrisp), pumpkins, and perhaps, candy come to mind. Do you recall the 1980s commercial about one such treat? We hope so because we are all in on this metaphor! Picture a “television set.” There's a commercial break. Some unsuspecting chocolate-obsessed pedestrian bumps into a wayward counterpart who is spooning gobs of peanut butter into their mouth – a kerfuffle ensues: “hey, you got peanut butter in my chocolate!” “Yeah, well, you got chocolate in my peanut butter!” All of this good-natured clumsiness ends with a cheerful tune, smiling faces, product placement, and tagline: “Two great tastes that taste great together.”
That was a long way of getting to our point: fidelity and capacity are two great measures that go great together and must be understood and evaluated collectively over time if implementation teams want to support, drive and celebrate sustained impact.
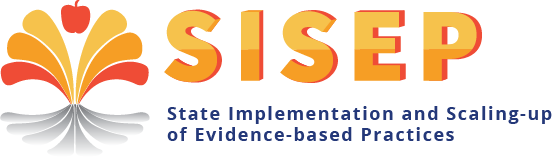
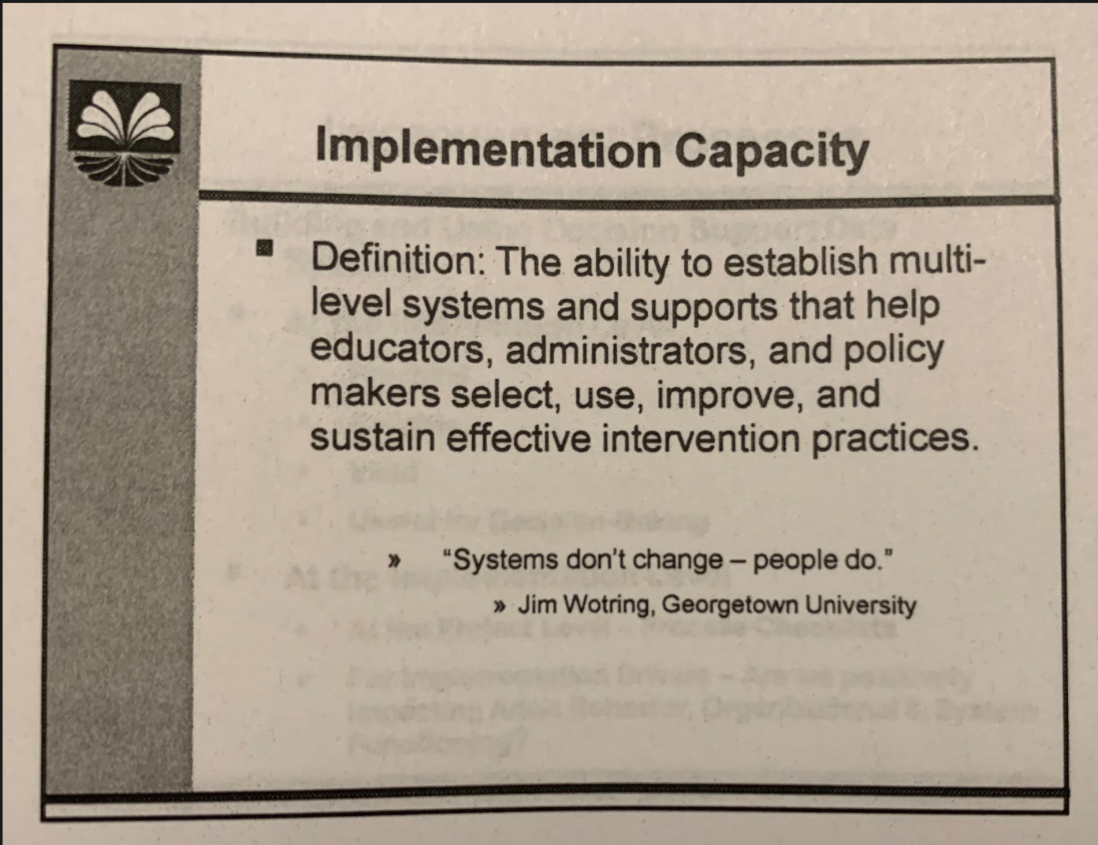
While pulling together our applied learning around these two concepts, we found some great old-school SISEP gems that continue to retain value when applied to our current work. Below is a slide shared when we started actively partnering with SISEP in 2009:
It was a transformative idea since it provided the logic and language we needed to understand our work as a State Education Agency (SEA) if we were serious about impacting outcomes. Much of our SEA work at that time (and still, to some extent) focused almost exclusively on student outcome data, full stop. We have learned, through the applied use of the Active Implementation Frameworks (AIFs), to appreciate their application to our work:
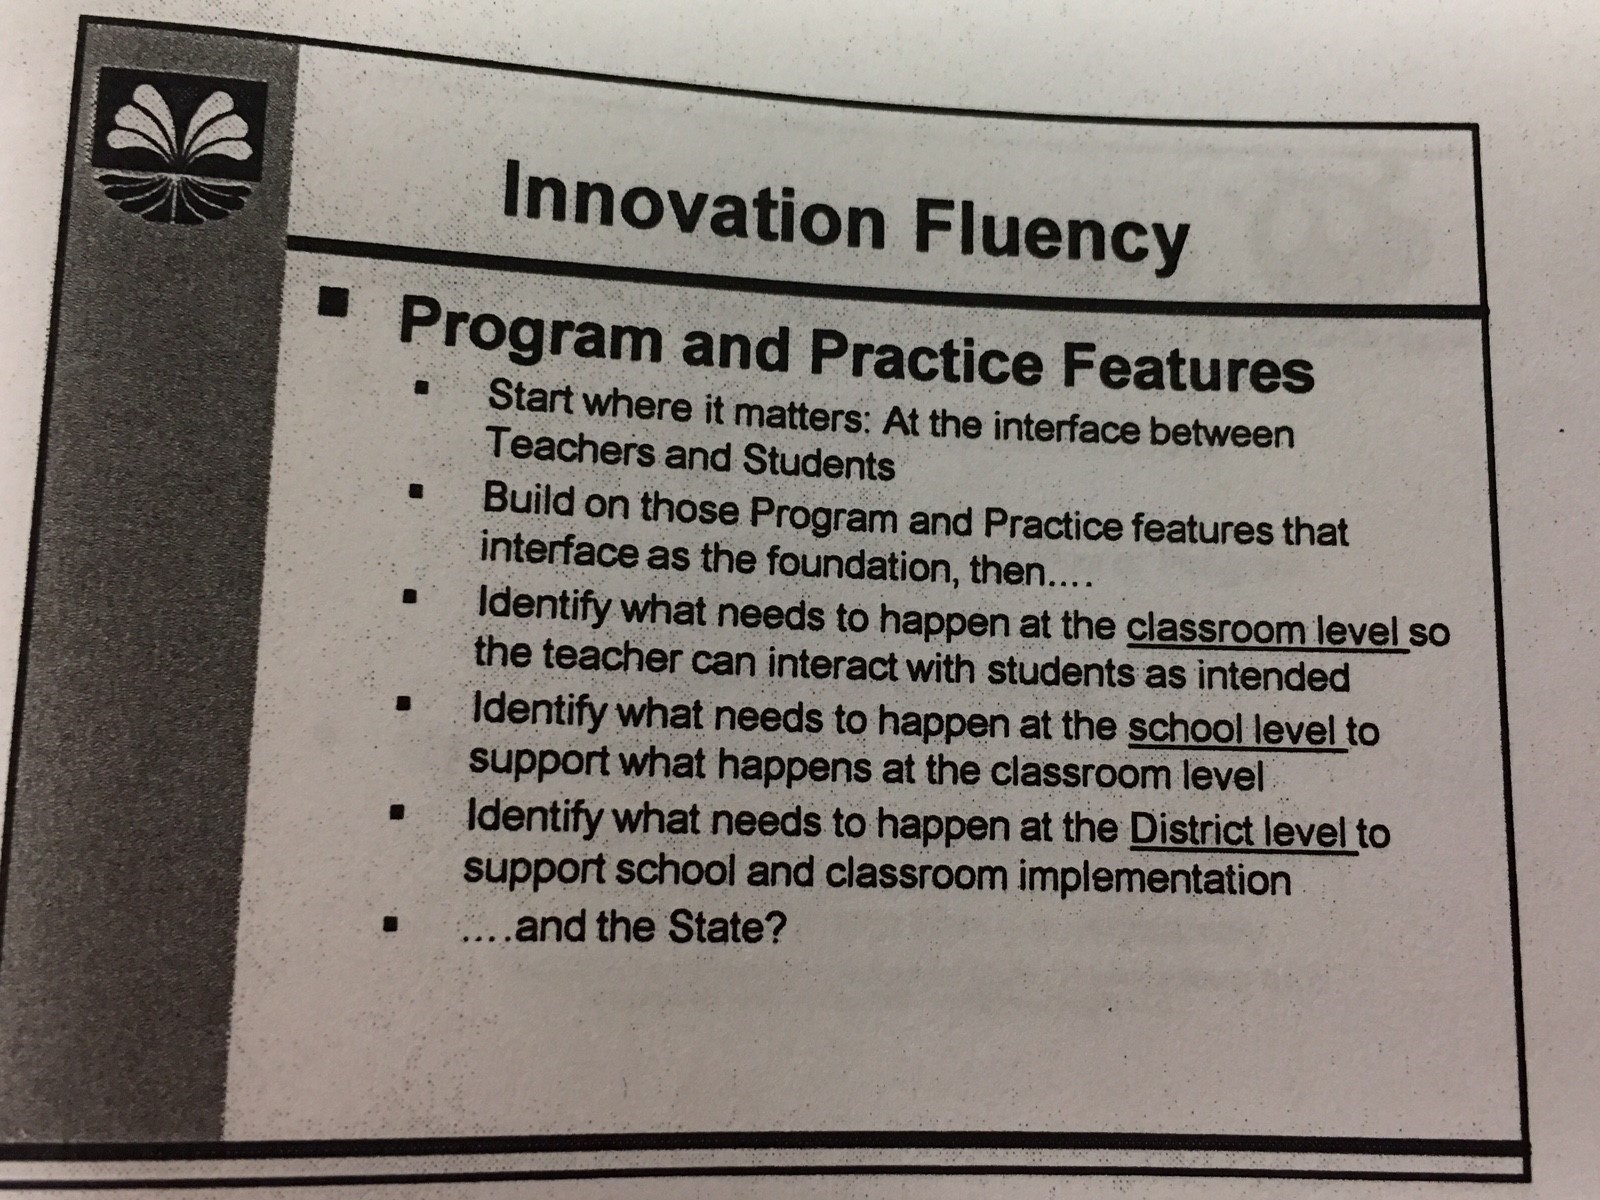
- Start with what an adult (typically, but not always, a teacher) does, ideally, with an evidence-informed practice in service to a learner (Usable Innovation), and
- Take the time to do the right work at the right time (Implementation Stages), and
- Understand the people and organizational factors that need to be managed continuously (Implementation Drivers), by
- Connected groups of people (Linked Teams) that are
- Using information continuously to “get started and get better” (Improvement Cycles).
These foundational building blocks are illustrated and aligned in the often-used Formula for Success.
We have learned to get started, get better, and measure. Here is where fidelity and capacity assessment come into play. Both are important and are needed to improve learner outcomes. Any educational organization (school, district, region, state, etc.) without evidence of practice fidelity is unlikely to effectively change student outcomes and is unlikely to sustain its implementation over time if practice fidelity is unsupported by systemic capacity. Both are inextricably linked, yet their growth or regression trajectory over time is not linear. This real-world variance underscores the importance of regularly measuring each (at least annually) to discover these emerging patterns. More importantly, developing this measuring “habit” improves an implementation team’s ability to recognize normal variance and how to effectively and efficiently provide timely, relevant forms of support.
Minnesota Reflections on Applied Experiences Measuring Fidelity and Capacity
Fidelity
Fidelity, simply described, is the degree to which an innovation or practice is used as intended. There’s more to unpack around this concept; to learn more, see the 2022 SISEP Brief - What is Fidelity? Measuring fidelity, our focus here, is crucial to improving results when selecting and using evidence-based practices (EBPs) or innovations. It will vary over time as elements change, such as setting conditions and practitioners who deliver the practice, making it worthwhile to measure. How might we interpret fidelity information as it relates to our outcome expectations? For example, how might your team differentiate and analyze the fidelity data obtained from a) a cohort of newly trained, novice practitioners compared to b) those who have completed training and had multiple opportunities to receive additional coaching support informed by regular fidelity data? Ultimately, evidence of being able to deliver the practice well (fidelity) is needed – so how might your team ensure that this information is used to support and improve implementation (and explicitly not used as an individual teacher evaluation tool)?
Minnesota Experience
The system that supports using any practice must systematically use fidelity information to ensure ongoing progress out of exploration through installation and initial implementation. This data helps differentiate the support needed across various practitioners with varied needs to achieve full and sustained implementation. It informs how training and coaching resources support growth in defined areas. The grain size of the data will change depending on if: 1) a coach is using it with a set of grade level teachers in a PLC, 2) a school team is using it across staff, 3) a district team is viewing it across schools, 4) a regional entity is viewing it across districts, or 5) a state team is viewing it across multiple regional entities and districts (i.e., transformation zones).
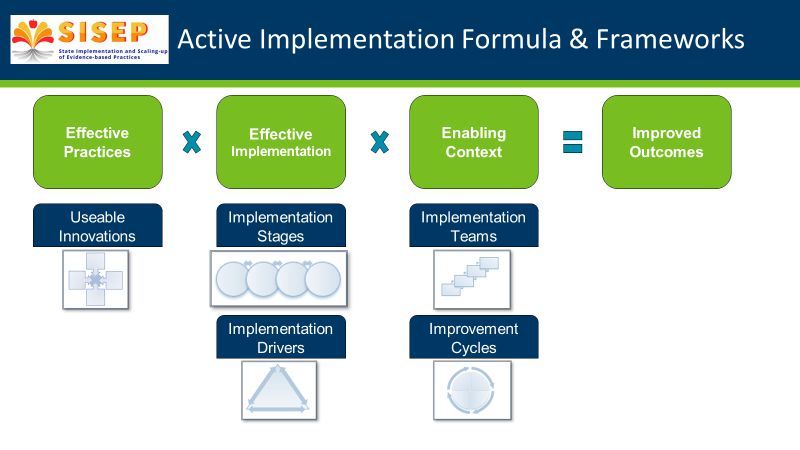
Below is a recent graph showing the trajectory of combined statewide fidelity scores across a two-year training cohort of school teams implementing an evidence-based set of practices. We have now observed this pattern over multiple training cohorts. What made this example salient was that these school teams, like previous cohorts, measured their fidelity at least three times annually and reached full fidelity during the COVID pandemic. This example challenged us to rethink generalized narratives and become more nuanced in understanding how the pandemic impacted our established capacity (e.g., the majority reached fidelity; the rate was slower). How might this information inform differentiated supports at different levels?
To see other applied MN and KY examples of fidelity data used to support teachers applying literacy and math practices, see the fidelity webinar from SISEP and some of its state partners.
Capacity
Capacity, in plain language, is first, the ability of a system to put evidence-based practices or innovations in place and keep them in place for as long as needed to benefit students who need them. Capacity helps describe and distribute the work across implementation teams. It helps moderate the impact of typical changes, such as turnover (e.g., administrator, initiative champion, coach/coordinator), new priorities, budget challenges, or unexpected crises like a global pandemic. The goal is to install the elements of capacity and maintain them at a high level over time to manage and support effective, sustained implementation.
Measured capacity may grow faster than practice fidelity, especially at first. Once capacity is built, the goal is to keep it at a high level across the years. The effectiveness of capacity is determined by the regular collection and review of fidelity-related measures. Consistently high fidelity in the practitioners expected to implement the EBP: 1) increases the number of practitioners who can implement the practice well, and 2) increases the number of students receiving support.
Minnesota experience
We learned much from several district implementation teams who could build effective, measured capacity over two to three years at a high level when that work was centered on a well-defined, evidence-informed innovation. These teams maintain and manage that capacity through ongoing District Capacity Assessments (DCAs) informing action planning. We have also observed district teams that expanded their capacity to multiple EBPs or usable innovations over time. This pathway required the district to start by doing at least one innovation well. We have evidence to suggest that the time necessary to expand, adjust and refine capacity for the next (or multiple) innovations can come more quickly the second time. We have yet to experience or see evidence suggesting a district or regional system can successfully implement or sustain multiple EBPs simultaneously without working through the learning curve of one.
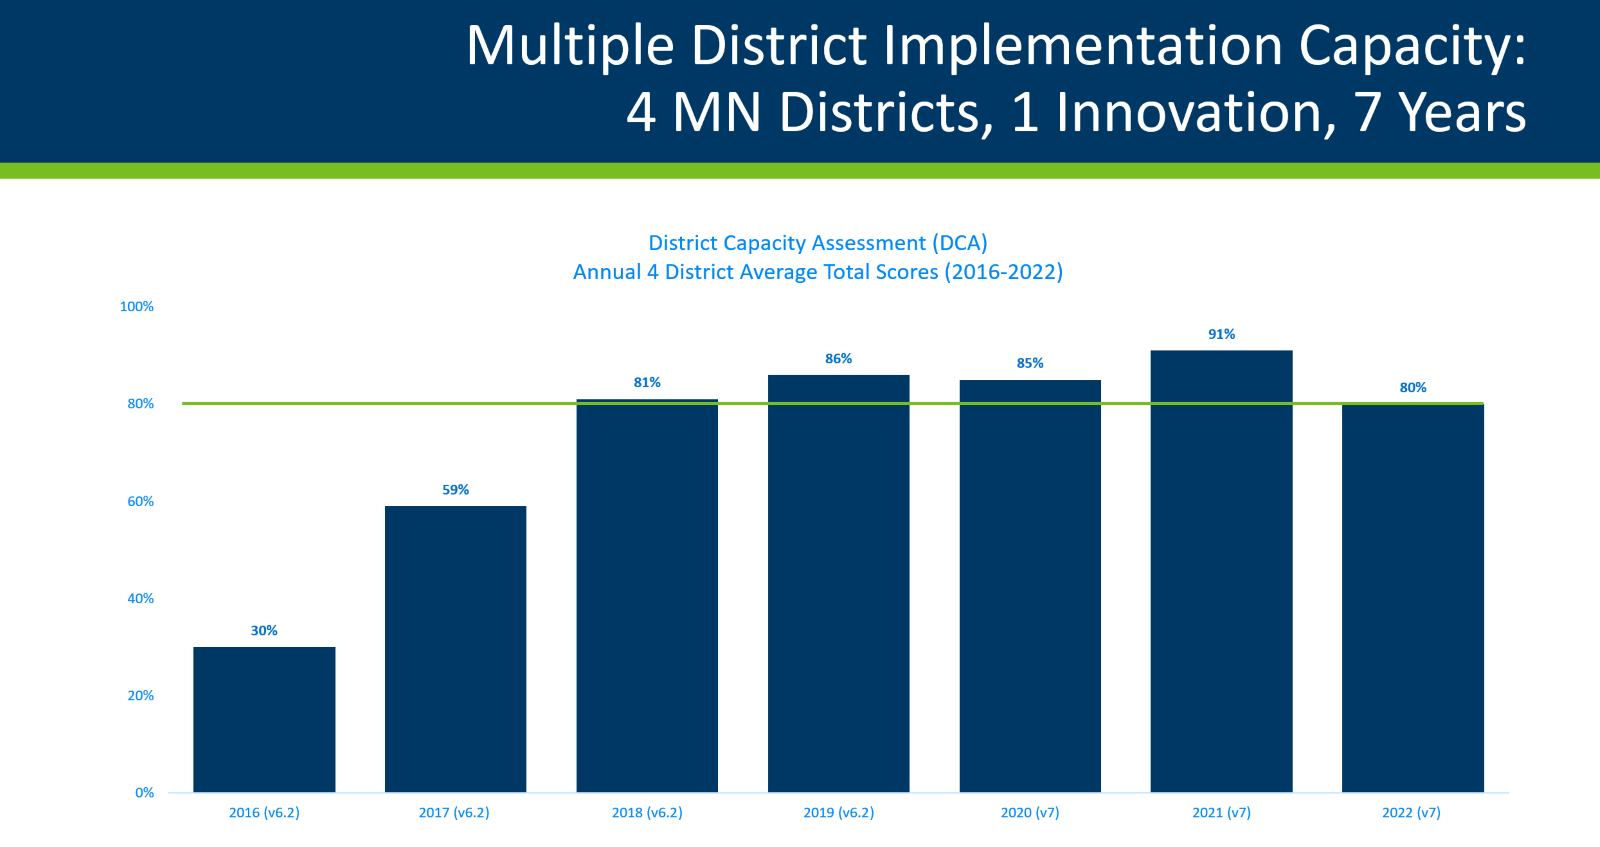
The graph below represents four districts within a single transformation zone. All have been implementing the same evidence-based practice for over seven years. Notice the growth, then variability. If you were involved in this work, would you want to see next year’s bar? Why?
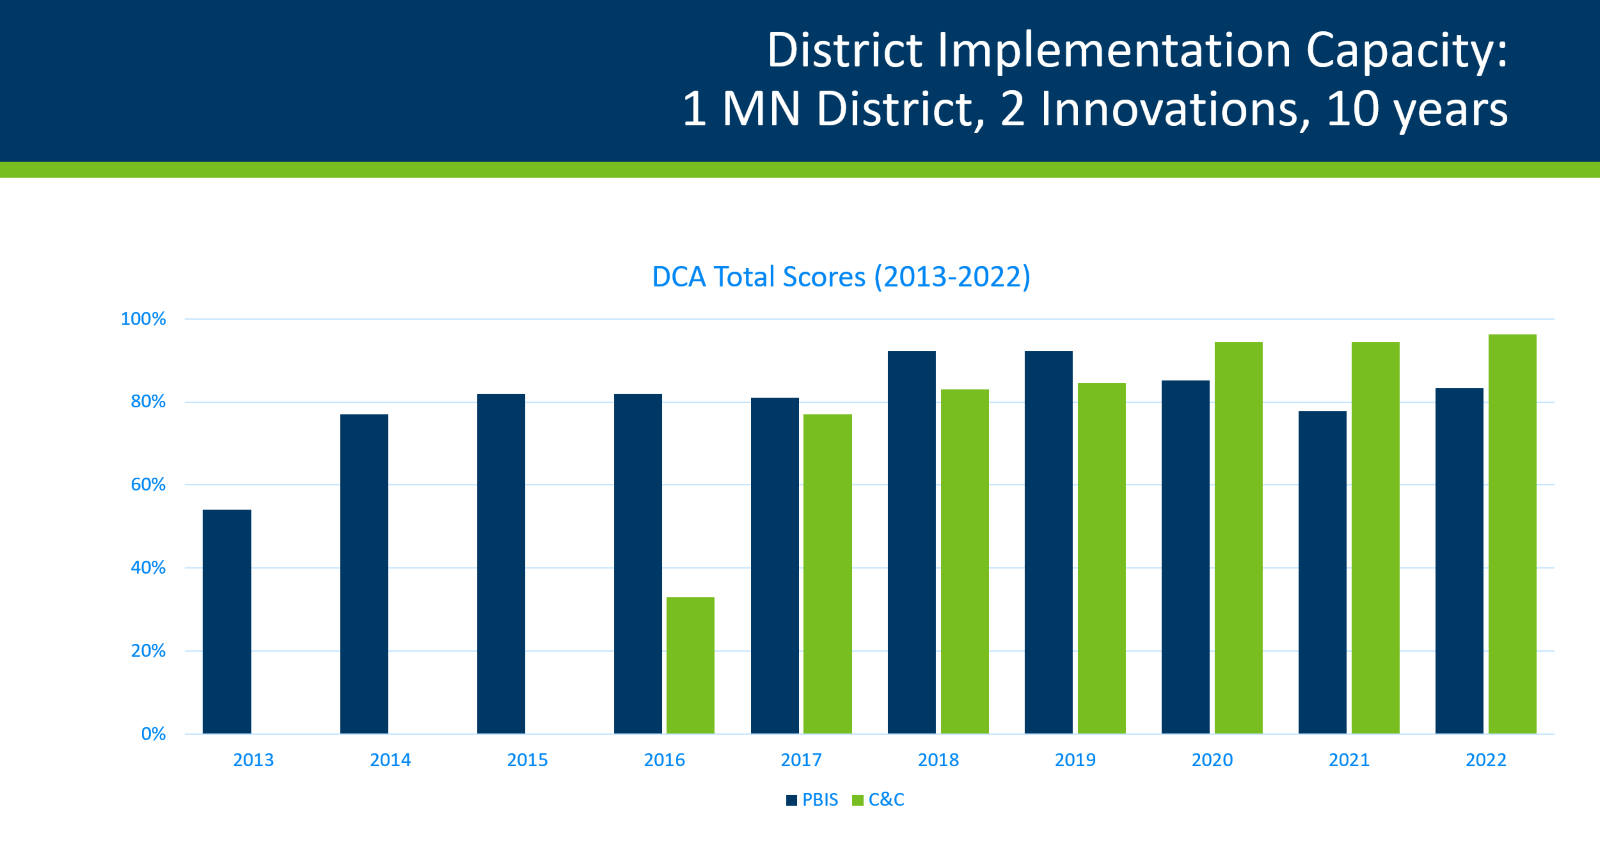
The following example shows one district implementing two innovations over a decade. Notice the capacity growth related to the first innovation, then how quickly the capacity to support a second innovation ramped up. If you were on this district’s implementation team, how invested might you be in measuring capacity for each of these innovations next year?
At a state level, we’ve observed that implementation efforts that remain beyond five years collect and use capacity and fidelity data regularly. Grounding implementation teams in this measurement "habit" will help sustain those efforts: a) across the inevitable changes of staff and administration, and b) when funding priorities or new initiatives compete for time, effort, focus, and resources.
Implementation Capacity and Evidence-Based Practice Fidelity
Pulling these ingredients together, we offer a new look at a fidelity and capacity scatter plot updated from an earlier version shared in Caryn Ward’s 2019 post on capacity and fidelity. While this picture may not look as yummy as chocolate and peanut butter, it is just as delicious, in a geeky kind of way! It illustrates nine points in time (covering roughly a decade). Each diamond represents a specific district capacity assessment score and the corresponding percentage of schools delivering an EBP at fidelity. Notice the “Go Zone” (high fidelity and high capacity) in the upper right-hand corner.
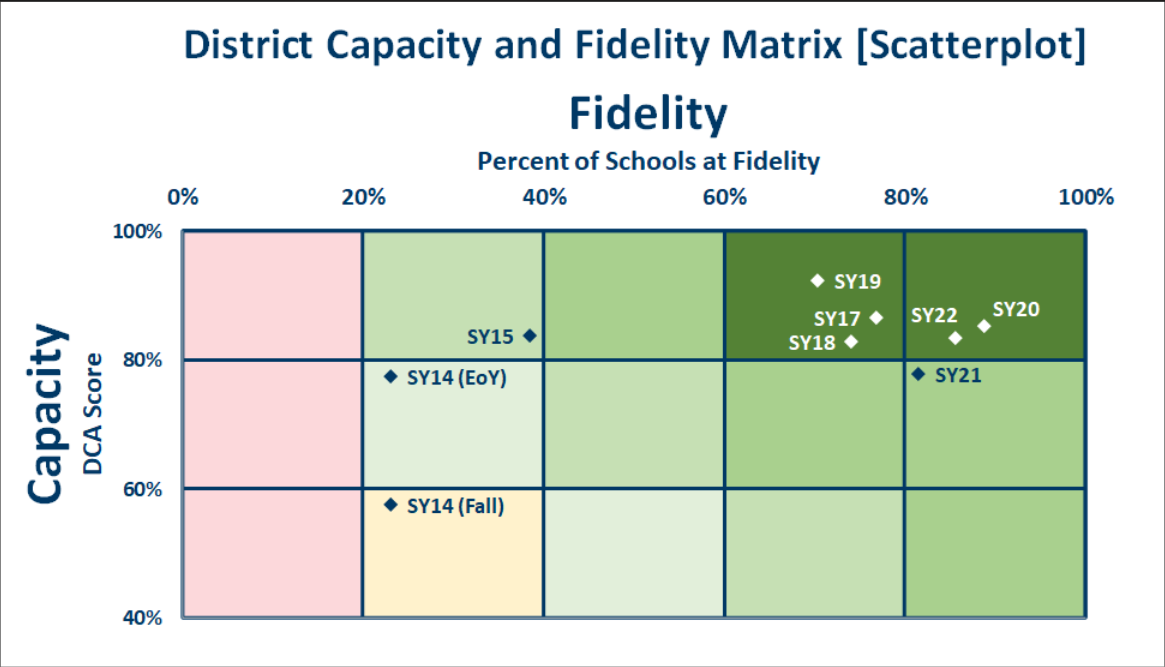
What does his scatter plot suggest to you? What next question might you ask? Impact on student outcomes, perhaps? Stay tuned, we’ll have more to share on that part of the success formula (spoiler alert, uh huh).
The relationship between capacity and fidelity is strong. Early on, there was a NIRN saying, “fidelity has an expiration date.” We agree! No student benefit can come from the capacity or fidelity you used to have – only what you have in place today and are working to address for the needs of tomorrow.
Ellen Nacik is a State Implementation Science Specialist, Garrett Petrie is an Education Specialist, and Eric Kloos is the Assistant Director of the Special Education Division at the Minnesota Department of Education.
References
Algozzine, B., Barrett, S., Eber, L., George, H., Horner, R., Lewis, T., Putnam, B., Swain-Bradway, J., McIntosh, K., & Sugai, G (2019). School-wide PBIS Tiered Fidelity Inventory. OSEP Technical Assistance Center on Positive Behavioral Interventions and Supports. www.pbis.org.
Kloos, E., Nacik, E., & Ward, C. (2022). Developing Implementation Capacity of a State Education Agency to Improve Outcomes for Students With Disabilities. Journal of Disability Policy Studies, 0(0). https://doi.org/10.1177/10442073221096393
St. Martin, K., Ward, C., Fixsen. D. L., Harms, A., Russell, C. (2015). Regional Capacity Assessment. National Implementation Research Network, University of North Carolina at Chapel Hill.
Ward, C., St. in, K., Horner, R., Duda, M., Ingram-West, K., Tedesco, M., Putnam, D., Buenrostro, M., & Chaparro, E. (2015). District Capacity Assessment. University of North Carolina at Chapel Hill.